Types of Graphs

Grades: 2-3
Summary: Learn Alberta has always short fun lessons for each strand. In the Data Analysis, students can choose two topics - Organizing Data and Creating Bar Graphs. Here is a breakdown of the activities:
Organizing Data:
Crystal #1 - Tally Marks
Crystal #2 - Tally Chart
Crystal #3 - Line Plot
Crystal #4 - Line Plot
Creating Bar Graphs:
Crystal #1 - Use tally chart to create bar graph
Crystal #2 - Label the data on the bar graph
Crystal #3 - Label the Bar Graph
Crystal #4 - Use the data in the bar graph to answer questions
How to integrate: Shared, Modeled, Independent
 Bar Graphs - Interactive
Summary: A great interactive tool to use on the SmartBoard to show how we create bar graphs.
How to integrate: Shared

Grades: 1-2
Summary: Olivia octagon will give a quick lesson on why it's important to use graphs.
How to integrate: Shared

Grades: 1-2
Summary: Count the animals and shade in the box.
How to integrate: Shared

Grades: 2-3
Summary: It seems there's an infestation in cybrary. Help graph the different colour bugs in each of the rooms to see how many there are altogether.
How to integrate: Shared, Independent

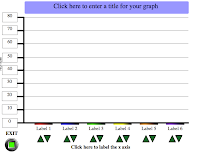
Grades: 1-3
Summary: Show your students how to make a simple pictograph using this website. You can customize the Picture, Scale and add a description and a title to your graph.
How to integrate: Shared, Independent