Showing posts with label
Data Management and Probability.
Show all posts
Under the Sea! - Data Analysis
Grades: 2-3
Summary: Learn Alberta has always short fun lessons for each strand. In the Data Analysis, students can choose two topics - Organizing Data and Creating Bar Graphs. Here is a breakdown of the activities:
Organizing Data:
Crystal #1 - Tally Marks
Crystal #2 - Tally Chart
Crystal #3 - Line Plot
Crystal #4 - Line Plot
Creating Bar Graphs:
Crystal #1 - Use tally chart to create bar graph
Crystal #2 - Label the data on the bar graph
Crystal #3 - Label the Bar Graph
Crystal #4 - Use the data in the bar graph to answer questions
How to integrate: Shared, Modeled, Independent
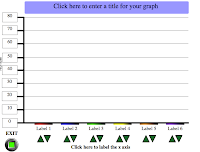 Bar Graphs - Interactive
Summary: A great interactive tool to use on the SmartBoard to show how we create bar graphs.
How to integrate: Shared
Exploring Graphing - Concrete Graph
Grades: 1-2
Summary: Olivia octagon will give a quick lesson on why it's important to use graphs.
How to integrate: Shared
Counting Animals - Concrete Graph
Grades: 1-2
Summary: Count the animals and shade in the box.
How to integrate: Shared
Cyber Chase - Bugs in the System
Grades: 2-3
Summary: It seems there's an infestation in cybrary. Help graph the different colour bugs in each of the rooms to see how many there are altogether.
How to integrate: Shared, Independent
Make your own Pictograph
Grades: 1-3
Summary: Show your students how to make a simple pictograph using this website. You can customize the Picture, Scale and add a description and a title to your graph.
How to integrate: Shared, Independent
Bar Graph
Grades: 2-3
Summary: Using either horizontal and vertical bar graphs, students will learn to interpret the graph by extracting important information from the graph. There are a variety of graphs to choose from.
How to integrate: Shared, Modeled
Pictograph
Grades: 2-3
Summary: Using horizontal and vertical pictograph, students must extract information from the pictographs. There are a choice of units to change the scale of the pictograph. Three questions to answer are: How many ... ?, How many more... than ... ? How many fewer ... than ...?
How to integrate: Shared, Modeled
Calculator Tally
Grades: 2-3
Summary: An easy start to having kids look at the data before it's put into the table.
How to integrate: Shared, Modeled
Survey Transport
Grades: 2-3
Summary: Collect data on a busy road. How many vehicles of each type pass by in a minute? Ask pupils to make comparisons between the groups. You can sort by colour or choose to sort by vehicle then choose to gather your data through tally, number or pictograph. Each round is 45 seconds.
How to integrate: Shared, Modeled *quick
Interactive Grapher
Grades: 2-3
Summary: Set your own choices and use this tool for a variety of surveys. Why is a block graph a good way of showing your results? What does the tallest column of blocks mean? How did the block graph help you to answer the question?
How to integrate: Shared
Birthday Pictograph
Grades: 2-3
Summary: Create a class chart of all the pupils' birthdays then use it as a stimulus for questions. Make boy and girl labels and drag them into the right month.
How to integrate: Shared
Present Sorting
Grades: 1-2
Summary: Sort the present by three attributes - colour, size, shape. Choose to sort the presents in different ways as they come off the conveyor belt. How many did you put in the right sacks?
How to integrate: Shared, Modeled
Fruit Sorting
Grades: 1-2
Summary: Simple sorting activity using fruit. Try the three different attributes.
How to integrate: Shared
Bear Sorting
Grades: 2-3
Summary: Ask pupils how to sort the initial 3 bears. How many groups will they use?
Then add bears one at a time to the screen and ask pupils to group them according to the same criteria.
Either focus on colour combinations or, more simply, use size as as a key criteria
How to integrate: Shared, Modeled
Grouping Aliens
Grades: 1-3
Summary: Sort the aliens into number groups based on the rule.
How do you know you need to put the 20 aliens in groups of 5 (or 10)? What clues are there? How many groups did you make? There are two modes.
How to integrate: Shared, Modeled
Sorting Shapes
Grades: 1-3
Summary: Ask pupils to sort a collection of shapes, choosing different criteria each time.
How to integrate: Shared, Modeled
Compare Shapes - Opposite Statements
Grades: 2-3
Summary: Compare two shapes using the comments listed, pressing pos/neg to get opposite statements. The orange "tester" panel is handy for focusing on one shape; rotating it while looking for right angles and lines of symmetry. Can any of the remaining shapes be matched up with the two original shapes? If so, put them in the same window - start with one statement in each window to make this exercise easier.
How to integrate: Shared, Modeled
Minibeast Sorter
Grades: 1-3
Summary: Choose a selection of minibeasts by dragging them into the tray. Choose the amount of sets you need and add labels with your own criteria. The sets can be overlapped to produce a Venn diagram display. Great first step towards a venn diagram.
How to integrate: Shared, Modeled
 Logic Zoo - Venn Diagrams
Grades: 1-3
Summary: Hacker has let loose the wacky animals of logic zoo! Help put them back in the proper place. Sort animals into the proper pens using the descriptions given for each pen.
How to integrate: Shared, Modeled, Independent
1) BBC Probability Bamzooks
Grades: 3-5
Summary: There are four mini games in all.
i.What is the outcome of the race using numbers.
ii. bonus game: just for fun: Race using the keyboard keys
iii. Using a spinner and % determine the outcome.
iv. bonus game: just for fun: Spin the wheel so fast that the zooks fall off
How to integrate: Independent
Great review game
2) Fish Tank Probability
Grades: 2-5
Summary: Figure out the probability of catching a red fish.
How to integrate: Shared, Independent

3) Probability Fair
Grades: 1-4
Summary: Win tickets in carnival games by making the correct outcomes and choosing the events with the highest chance of winning.
How to integrate: Shared, Independent
Bonjour! I admit my french is only comme ci, comme ça at best, but I can't forget the french immersions teachers and kids so I went searching for something that would work in a classroom.
Café des MATHadores from TFO has four great games that target a different math strand.